
A research team led by Prof. ZHENG Zhenya from the Shanghai Astronomical Observatory (SHAO) of the Chinese Academy of Sciences, together with collaborators, has investigated quasar variability by tracking optical to mid-infrared (MIR) wavelengths of variability information.
This multiband joint analysis provides an opportunity to probe the dust structure in the quasar's central region and holds promise for revealing key properties such as its scale and distribution. It offers crucial observational evidence for refining the "unified model" of active galactic nuclei (AGNs).
The results were published in The Astrophysical Journal.
Using the million quasars catalog released by Prof. WU Xuebing's team at Peking University, the researchers selected four quasars exhibiting high variability in the near-infrared (Ks-band) as detected by the VVV/VVVX time-domain survey of the Visible and Infrared Survey Telescope for Astronomy (VISTA).
Quasars are extremely luminous AGNs in the universe, characterized by their bright point-like morphology and significant brightness variability. This variability enables scientists to apply reverberation mapping techniques to trace the propagation of central radiation, thereby revealing the material structure in the vicinity of black holes. Theoretically, combining reverberation mapping observations across optical, near-infrared (NIR), and MIR bands can provide a more comprehensive perspective for such studies.
Based on the NIR observational data from the VVV/VVVX time-domain survey, the researchers conducted time-delay analyses for three highly variable quasars across optical (Pan-STARRS, ZTF), NIR (VISTA-VVV/VVVX), and MIR (WISE) bands. Using the measured time delays and the typical sublimation temperatures of dust particles, the researchers further applied theoretical formulas for the sublimation radii of graphite and silicate grains to estimate that the relative size ratio of graphite to silicate particles in the dust torus is approximately 0.4, indicating that within the dust torus, smaller graphite particles dominate the radiation in the NIR, while larger silicate particles primarily contribute to the MIR radiation.
The researchers carried on a detailed analysis of the brightest quasar in the sample, VVV J1845-2426. By combining spectroscopic data obtained from the Lijiang 2.4-meter optical telescope, the researchers measured the quasar's redshift to be approximately z = 0.25 and a central black hole mass of log10(MBH/Msun)=8.6±0.1. Through further multi-band spectral energy distribution (SED) fitting, they also identified indications of the presence of polar dust in this source.
"By analyzing the multi-band joint variability of AGNs, this study successfully captured the 'echo' of dust responding to the central radiation across different bands and estimated the size ratio of the two main components in the dust torus. This result is significant for understanding the distribution and physical properties of dust around AGNs," said LONG Lin, first author of the study.
Despite the rapid development of time-domain astronomy, comprehensive studies covering optical, NIR, and MIR bands together remain relatively scarce, leading to a limited sample size. To overcome this limitation, it is necessary to systematically integrate multiband observational data to identify more AGNs that exhibit strong variability across multiple bands, thereby significantly expanding the sample base for reverberation mapping research.
"It is encouraging to anticipate that with the Vera C. Rubin Observatory and the SPHEREx space telescope commencing scientific operations, they will bring new observational opportunities for dust reverberation mapping studies of AGNs," said Prof. ZHENG Zhenya, Corresponding author of the study.
This work was supported by the National Key R&D Program of China, the China-Chile Joint Research Fund, the China Manned Space Program, and other projects.
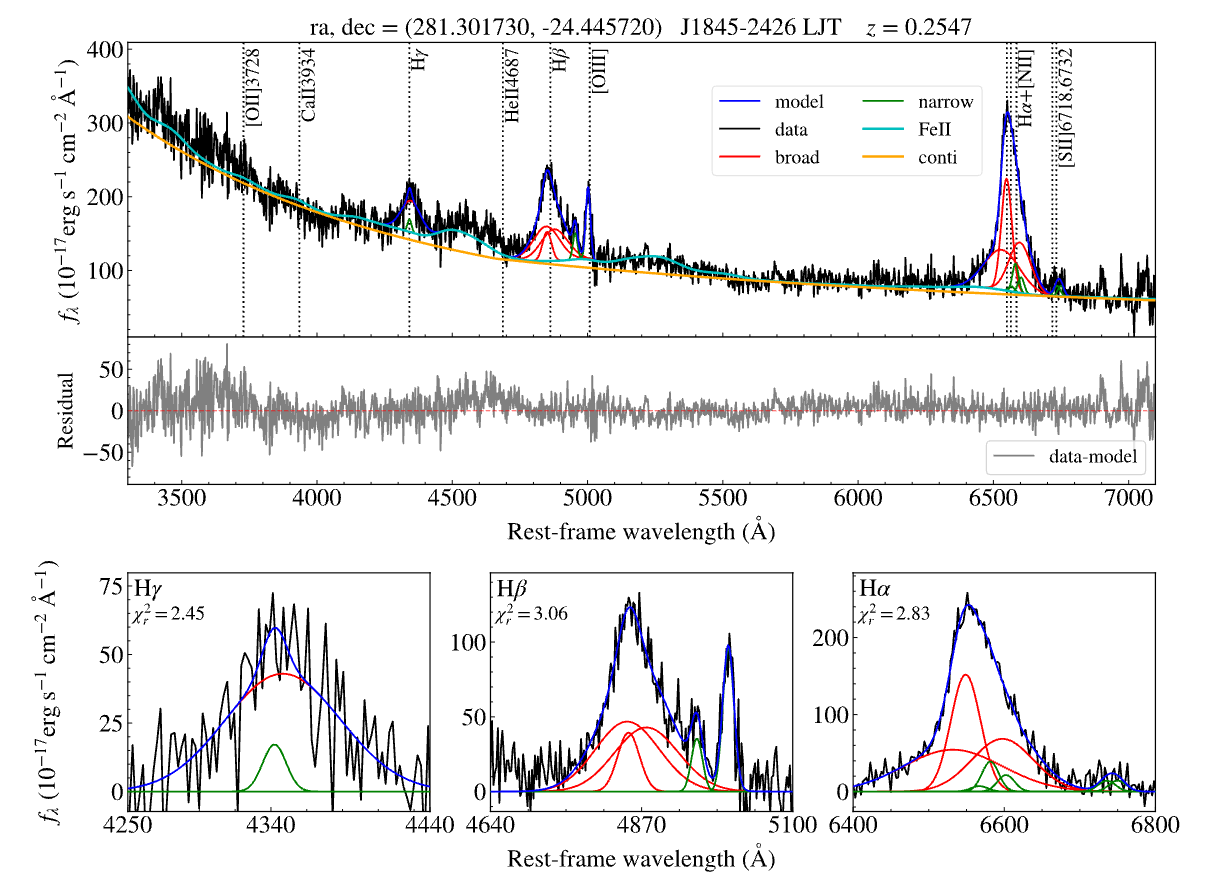
Spectral fitting results for VVV J1845-2426 (Lijiang 2.4m optical telescope). In the top panel, the spectrum (black line) is decomposed into a power-law continuum (orange line), Fe II emission (cyan line), and emission lines (blue line). The emission lines include broad (red line) and narrow (green line) components. The middle panel shows the residuals between the spectrum and the fitted model. The bottom panel presents the fitting results for the Hα, Hβ and Hγ emission lines, respectively. (Image by SHAO)
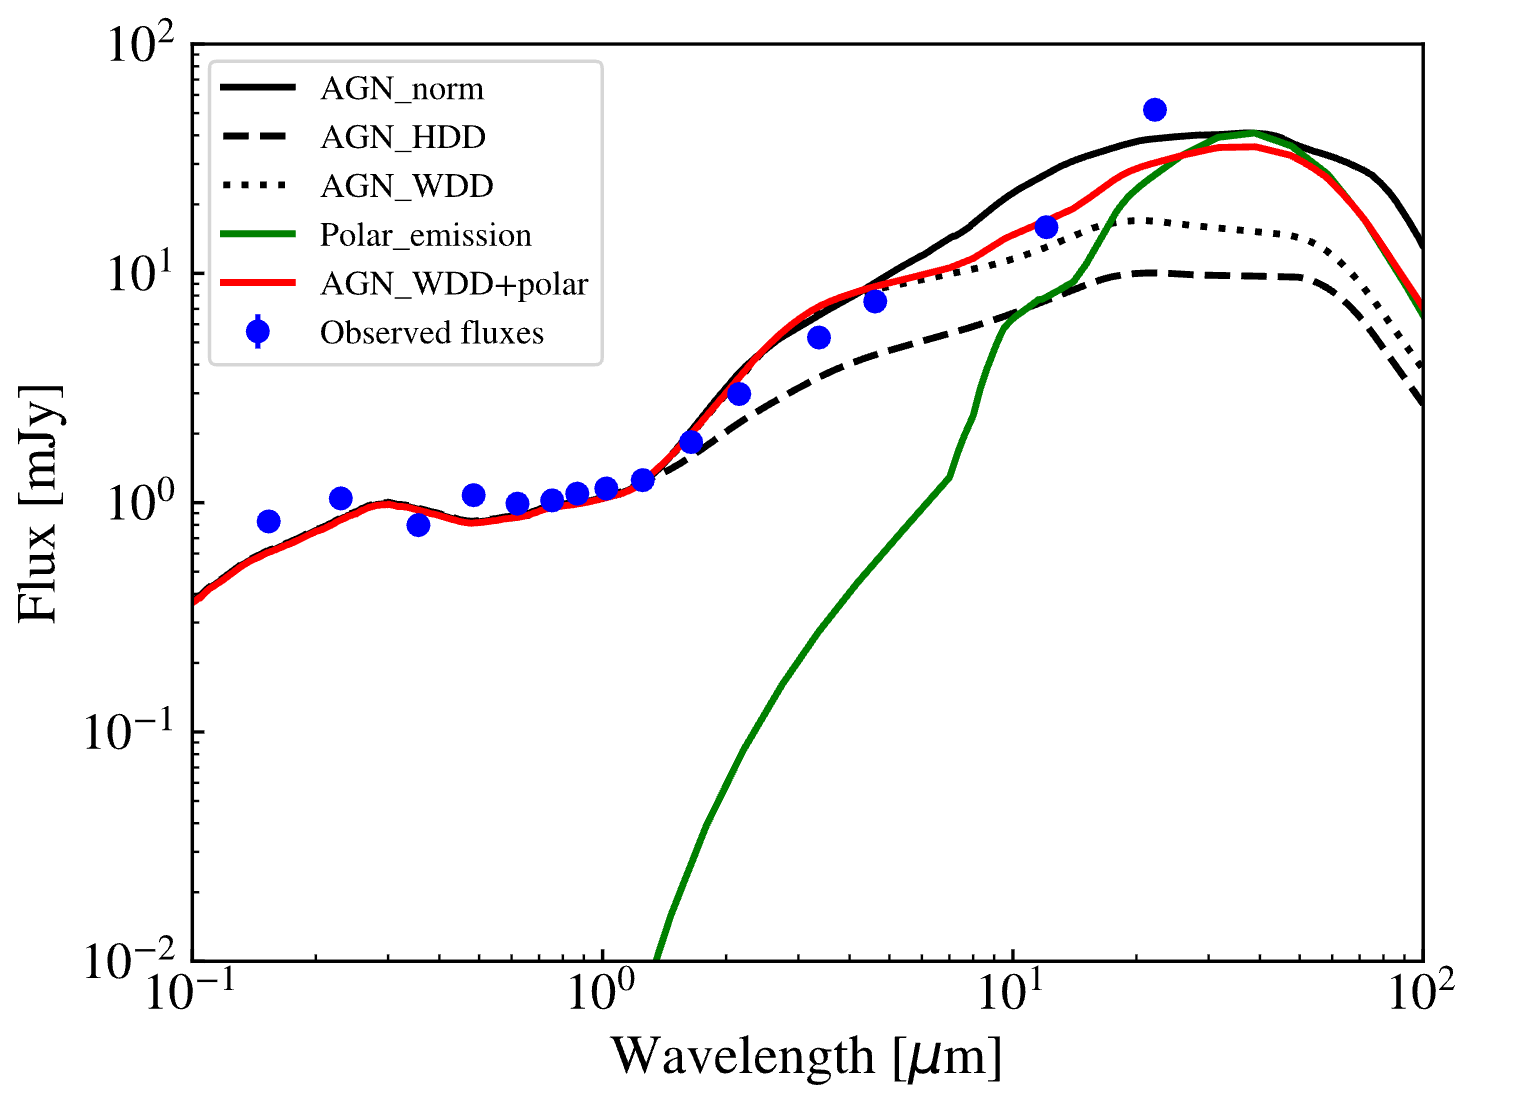
SED fitting results for VVV J1845-2426. The fitting was performed using AGN templates. The best-fit model (red line) is a combination of the warm-dust-deficient AGN template and the polar dust component. (Image by SHAO)

86-10-68597521 (day)
86-10-68597289 (night)

52 Sanlihe Rd., Xicheng District,
Beijing, China (100864)
Copyright © 2002 - Chinese Academy of Sciences


