
Scientists conducted a study to theoretically guide developing thermoelectric materials with better performance.
Thermoelectric materials, turning waste heat into electricity, are expected to ease the energy crisis.
Although FeNbSb, a kind of alloy matierial, is seen as a promising candidate, it possesses relatively high thermal conductivity which weakens its thermoelectric performance.
Previousely, researchers found that the isoelectronic substitution of V for Nb succeeds in reducing the thermal conductivity of FeNbSb. However, doping Ti can not only enhance the phonon scattering but also optimize the hole concentration which further improves the thermoelectric performance of FeNbSb based materials.
What is the difference of defect distribution between the two doping systems?
To answer that question, Prof. ZHANG Yongsheng and his team at Institute of Solid State Physics, Hefei Institutes of Physical Science, used density-functional calculations in combination with the cluster expansion and Monte Carlo methods to study the defect distribution of two Fe(Nb,V)Sb and Fe(Nb,Ti)Sb systems.
According to their study, the V and Ti exhibit different distribution behaviors in FeNbSb at low temperature. So, it is a crucial issue to explore the influence of defect distribution on its thermoelectric performance.
Through studying the influence of defect distribution on the electrical and thermal properties, the team proposed the (composition, temperature) conditions for the experimental synthesis to improve the thermoelectric performance of FeNbSb based materials by reducing the thermal conductivity: lowering the experimental preparation temperature to around the phase boundary to form the mixture of solid solutions and phase separations.
The research was supported by the financials of National Natural Science Foundation of China and the Major/Innovative Program of Development Foundation of Hefei Center for Physical Science and Technology Grant. The calculations were performed in the Center for Computational Science of CASHIPS, the ScGrid of Supercomputing Center and Computer Network Information Center of the Chinese Academy of Sciences.
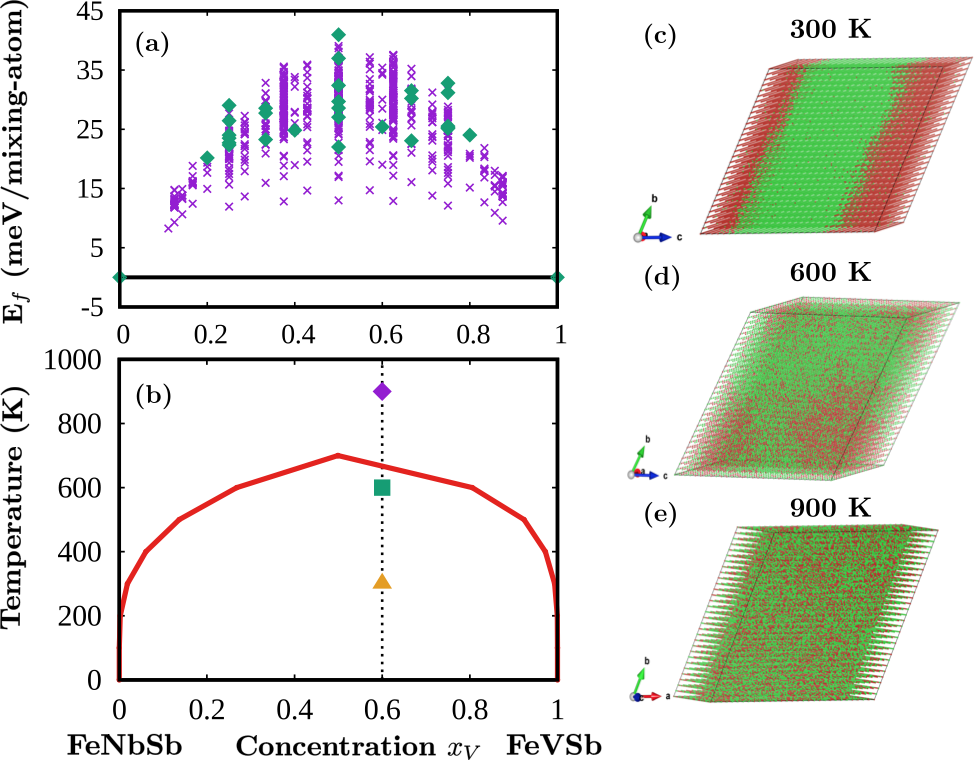
Fig. 1. DFT+CE predicted ground state line (a) and MC predicted temperature-composition phase diagram (b) of the Fe(Nb,V)Sb system. The green diamond and purple cross in (a) mean the mixing energies calculated by DFT and predicted using the ECIs, respectively, and the ground state line (black line) contains only FeNbSb and FeVSb with no stable intermediate compounds. The red and the vertical dashed lines in (b) represent the phase boundary and the experimentally interested V concentration (xv= 60%), respectively. The yellow triangle, green cubic and purple diamond represent as temperature at 300, 600 and 900 K, respectively, (c), (d) and (e) are the corresponding snapshots of (V, Nb) distributions in the matrix (V and Nb are the green and red points) from MC simulations for FeNb0.4V0.6Sb. (Image by GUO Shuping)
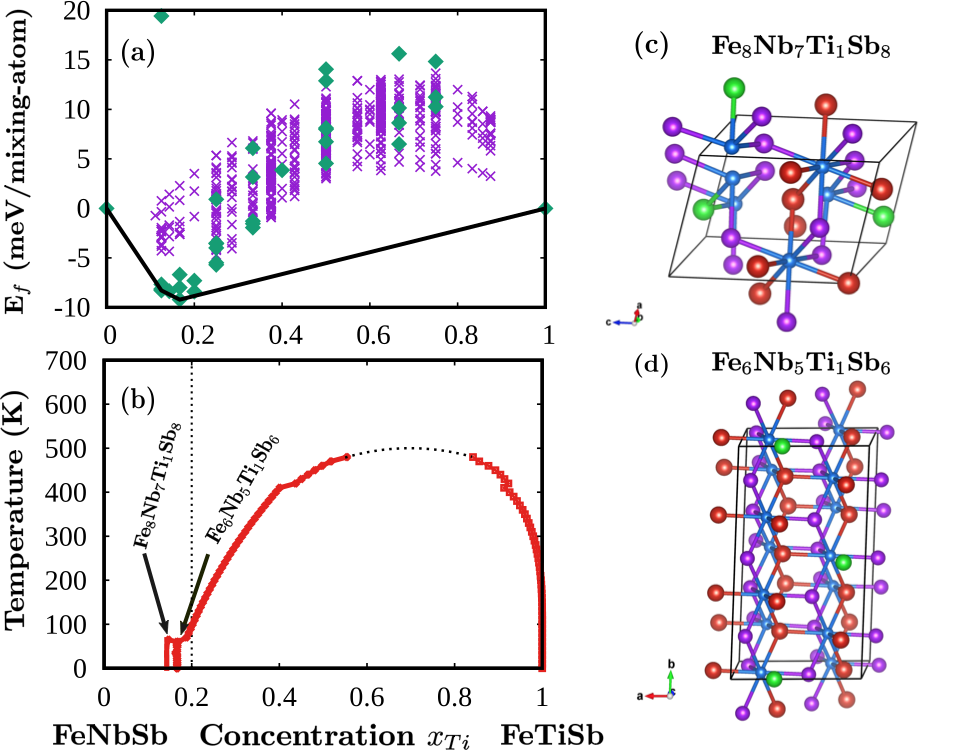
Fig. 2.DFT+CE predicted ground state line (a) and MC predicted temperature-composition phase diagram (b) of the FeNb1-xTixSb system. The green diamond and purple cross in (a) mean the mixing energies calculated by DFT and predicted using the ECIs, respectively, and the ground state line (black line) contains the pristine FeNbSb, FeVSb and two stable intermediate compounds (Fe8Nb7Ti1Sb8and Fe6Nb5Ti1Sb6). The red and the vertical dashed lines in (b) represent the phase boundary and the experimentally interested Ti concentration (xTi= 20%). The crystal structures of theoretically predicted two ground states are shown in (c) and (d). The blue, red, green and purple spheres represent the Fe, Nb, Ti and Sb atoms, respectively. (Image by GUO Shuping)
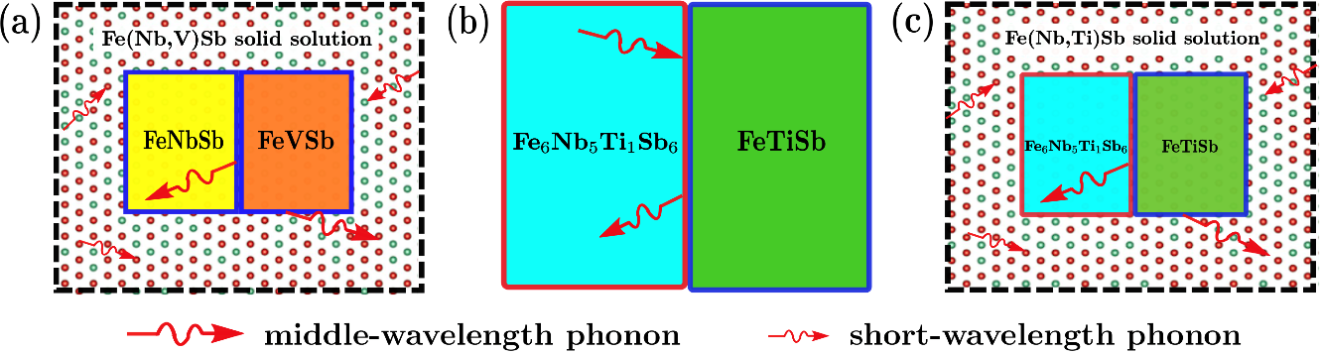
Fig. 3. Phase diagrams illustrating various phonon scattering mechanisms: solid solution mixed with coherent interfaces in Fe(Nb,V)Sb (a); incoherent interfaces in Fe(Nb,Ti)Sb (b); solid solution mixed with coherent interfaces in Fe(Nb,Ti)Sb (c). The same and different colors at the boundary represent the coherent and incoherent interfaces, respectively. (Image by GUO Shuping)

86-10-68597521 (day)
86-10-68597289 (night)

86-10-68511095 (day)
86-10-68512458 (night)

cas_en@cas.cn

52 Sanlihe Rd., Xicheng District,
Beijing, China (100864)
Copyright © 2002 - Chinese Academy of Sciences


